.jpg)
Total Rewards


Summary
• Selected to lead design of Total Rewards by Aquent's CEO
• Collaborated with the Director of Data & Analytics and PMs to craft data story requirements
for each benefit
• Conducted fast-tracked user research via focus groups
• Synthesized learnings into key insights and devised design principles of visibility and accessibility of benefits
• Designed wireframes for various scenarios and personas, and crafted variations of dashboard layouts
• Presented wireframes to CEO and executive leadership for approval
• Conducted user testing on low-fidelity concepts with employees and managers in Maze with nearly 100% direct success rate on tasks
• Created atomic design system with data visualization components in Figma, along with high-res prototypes
• Presented to CEO and worked with engineering to facilitate dev-handoff
.jpg)
.jpg)
.jpg)
Solving for the underutilization of <employee benefits>
Benefits are paid for by the company, but go to waste
Internal employees had poor visibility and access into their employee benefits and as a result, benefits were often left paid for, but underutilized.
Employee attrition is tied to benefits usage
Data showed that employees who do not utilize their benefits have a higher chance of leaving the company.
Benefit policies were unclear and HR was inundated with questions
Employees struggled to find detailed information on benefit policies, and resorted to contacting HR for answers.
Scattered benefit portals resulted in poor accessibility of benefits
Employees were uncertain how to take advantage of benefits and would eventually forget or would give up.
Advocating for our <users> to the CEO
The CEO initially presented Total Rewards as a solution for higher employee attrition in our first meeting; he wanted to show employee's the total cost of their full benefits package (a.k.a., Total Rewards) to allow them to see that their compensation was more than just their base salary.
To course correct towards a human-centered design approach, I expressed that we needed to provide value to the users, not just the business. With his permission, I began conducting generative research that unveiled the root of the problem - many employees did not have a full grasp of their benefits, and as a result benefits were being underutilized. For instance, countless employees passed on using their ELF funds, an $8,000 annual educational stipend, simply because processes were unclear.
Empathize & define
I conducted generative research to understand the employees' experience with their benefits. The key insight? Benefits were lacking in terms of clarity, visibility, and accessibility. These became the project's core design principles.
.png)
.png)
A data-viz dashboard to <centralize> employee benefits
The solution took form as a dashboard that centralized benefits, simplifying an employee's ability to view, understand, and then take advantage of their benefits. It also encouraged use by telling the story of how much they are leaving on the table.
Lofi mocks
I began ideation by individually translating each data story into lofi visual designs. Adhering to the design principles, each data story provided users with visibility into their benefits, as well as accessibility to the disparate benefits portals (i.e., Fidelity, Cigna).
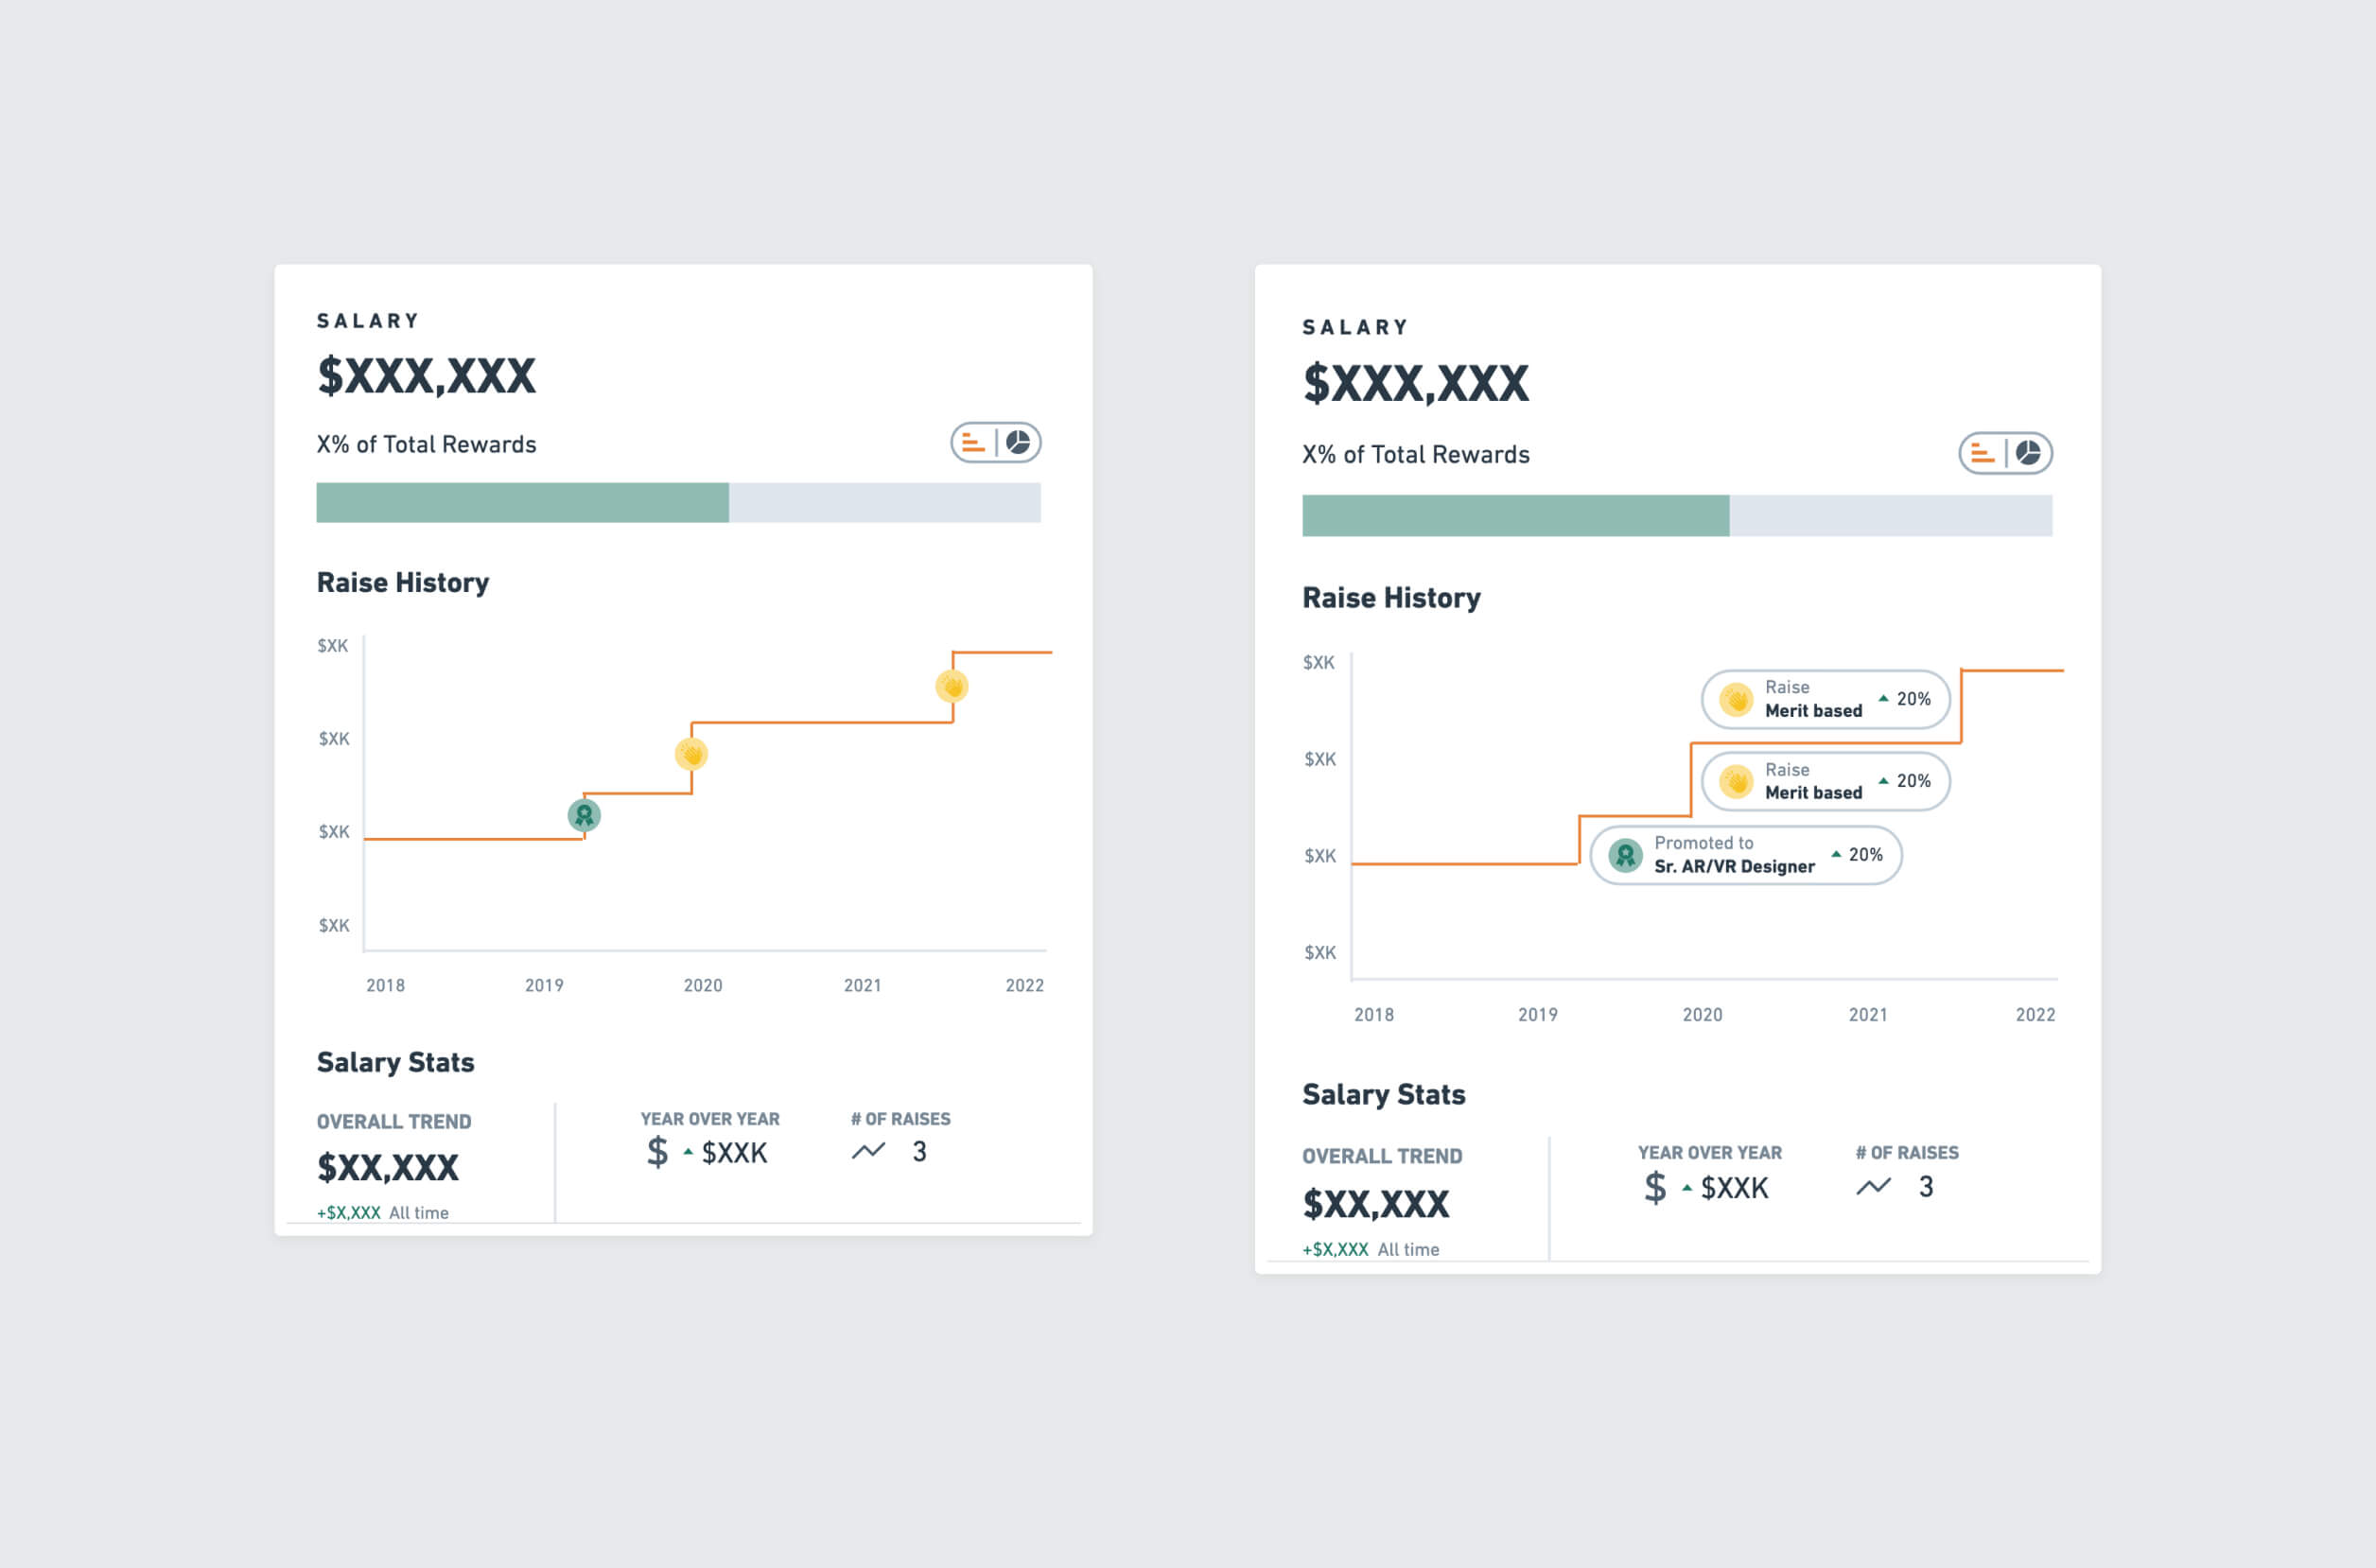
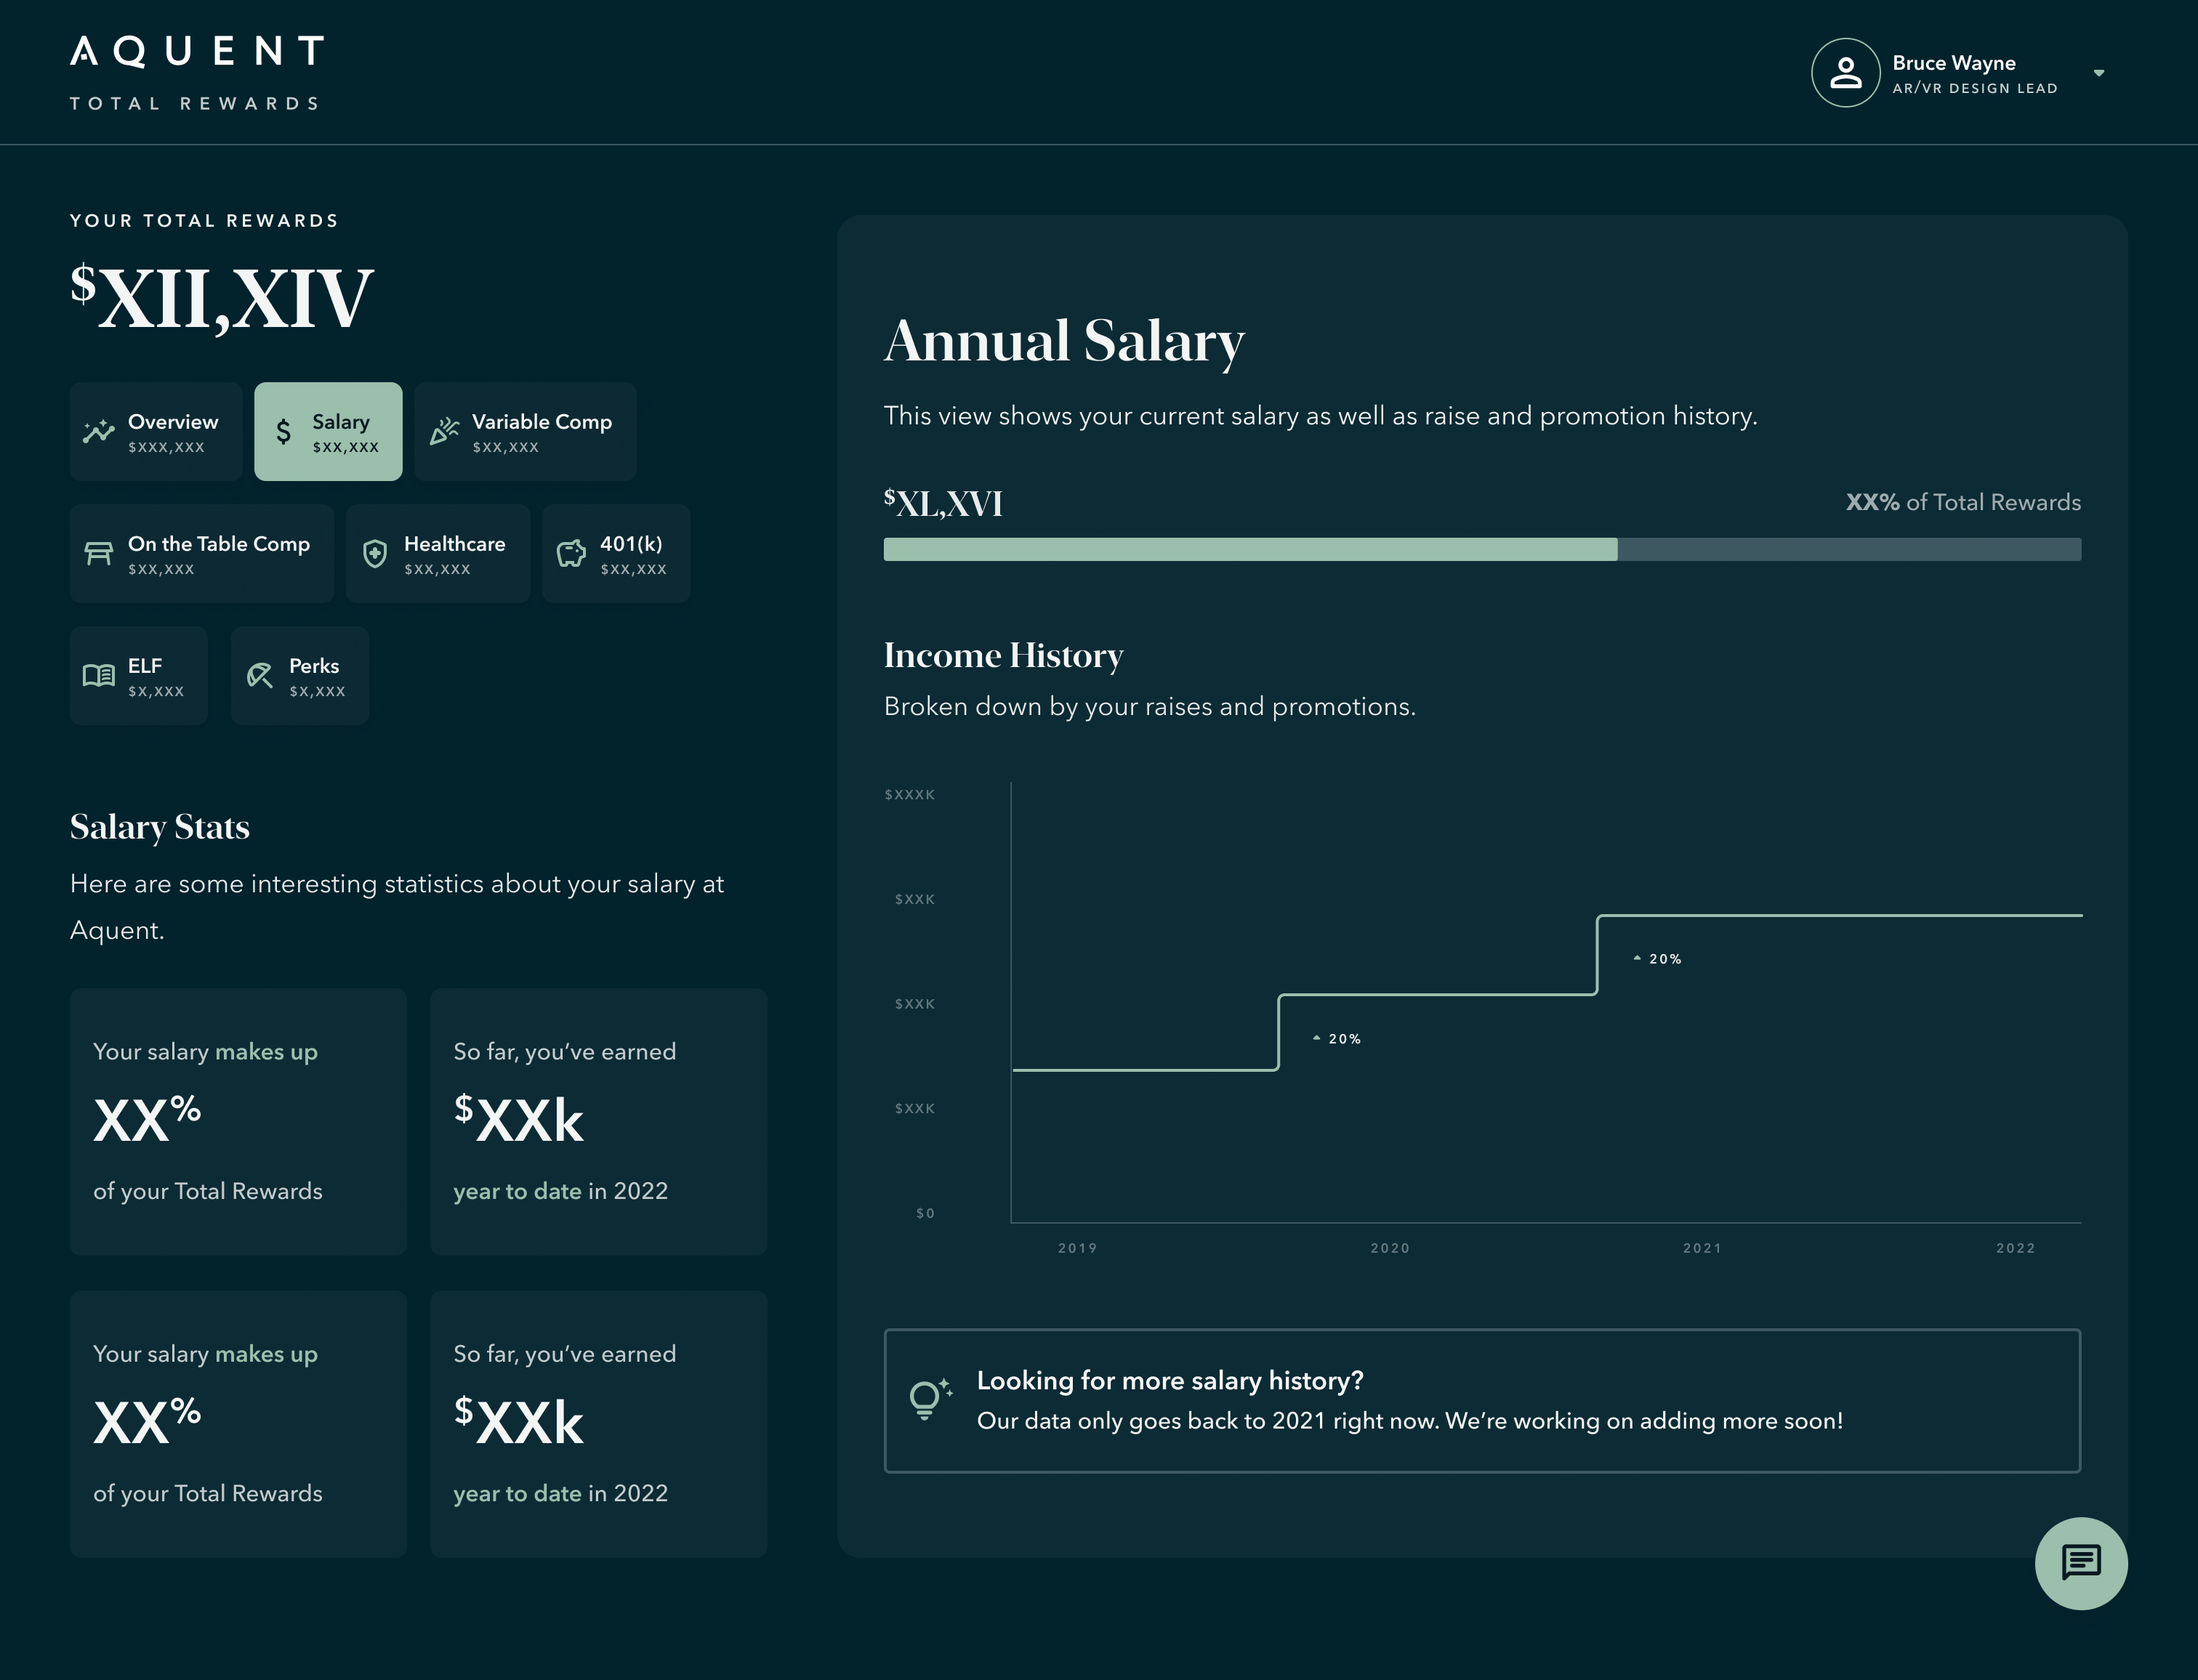
Salary
A stepped line graph displayed "raise history" marked by promotions and merit based increases.
Grants
The most complex data-story by far, grants showed overlapping vesting periods, share price and more.
.jpg)
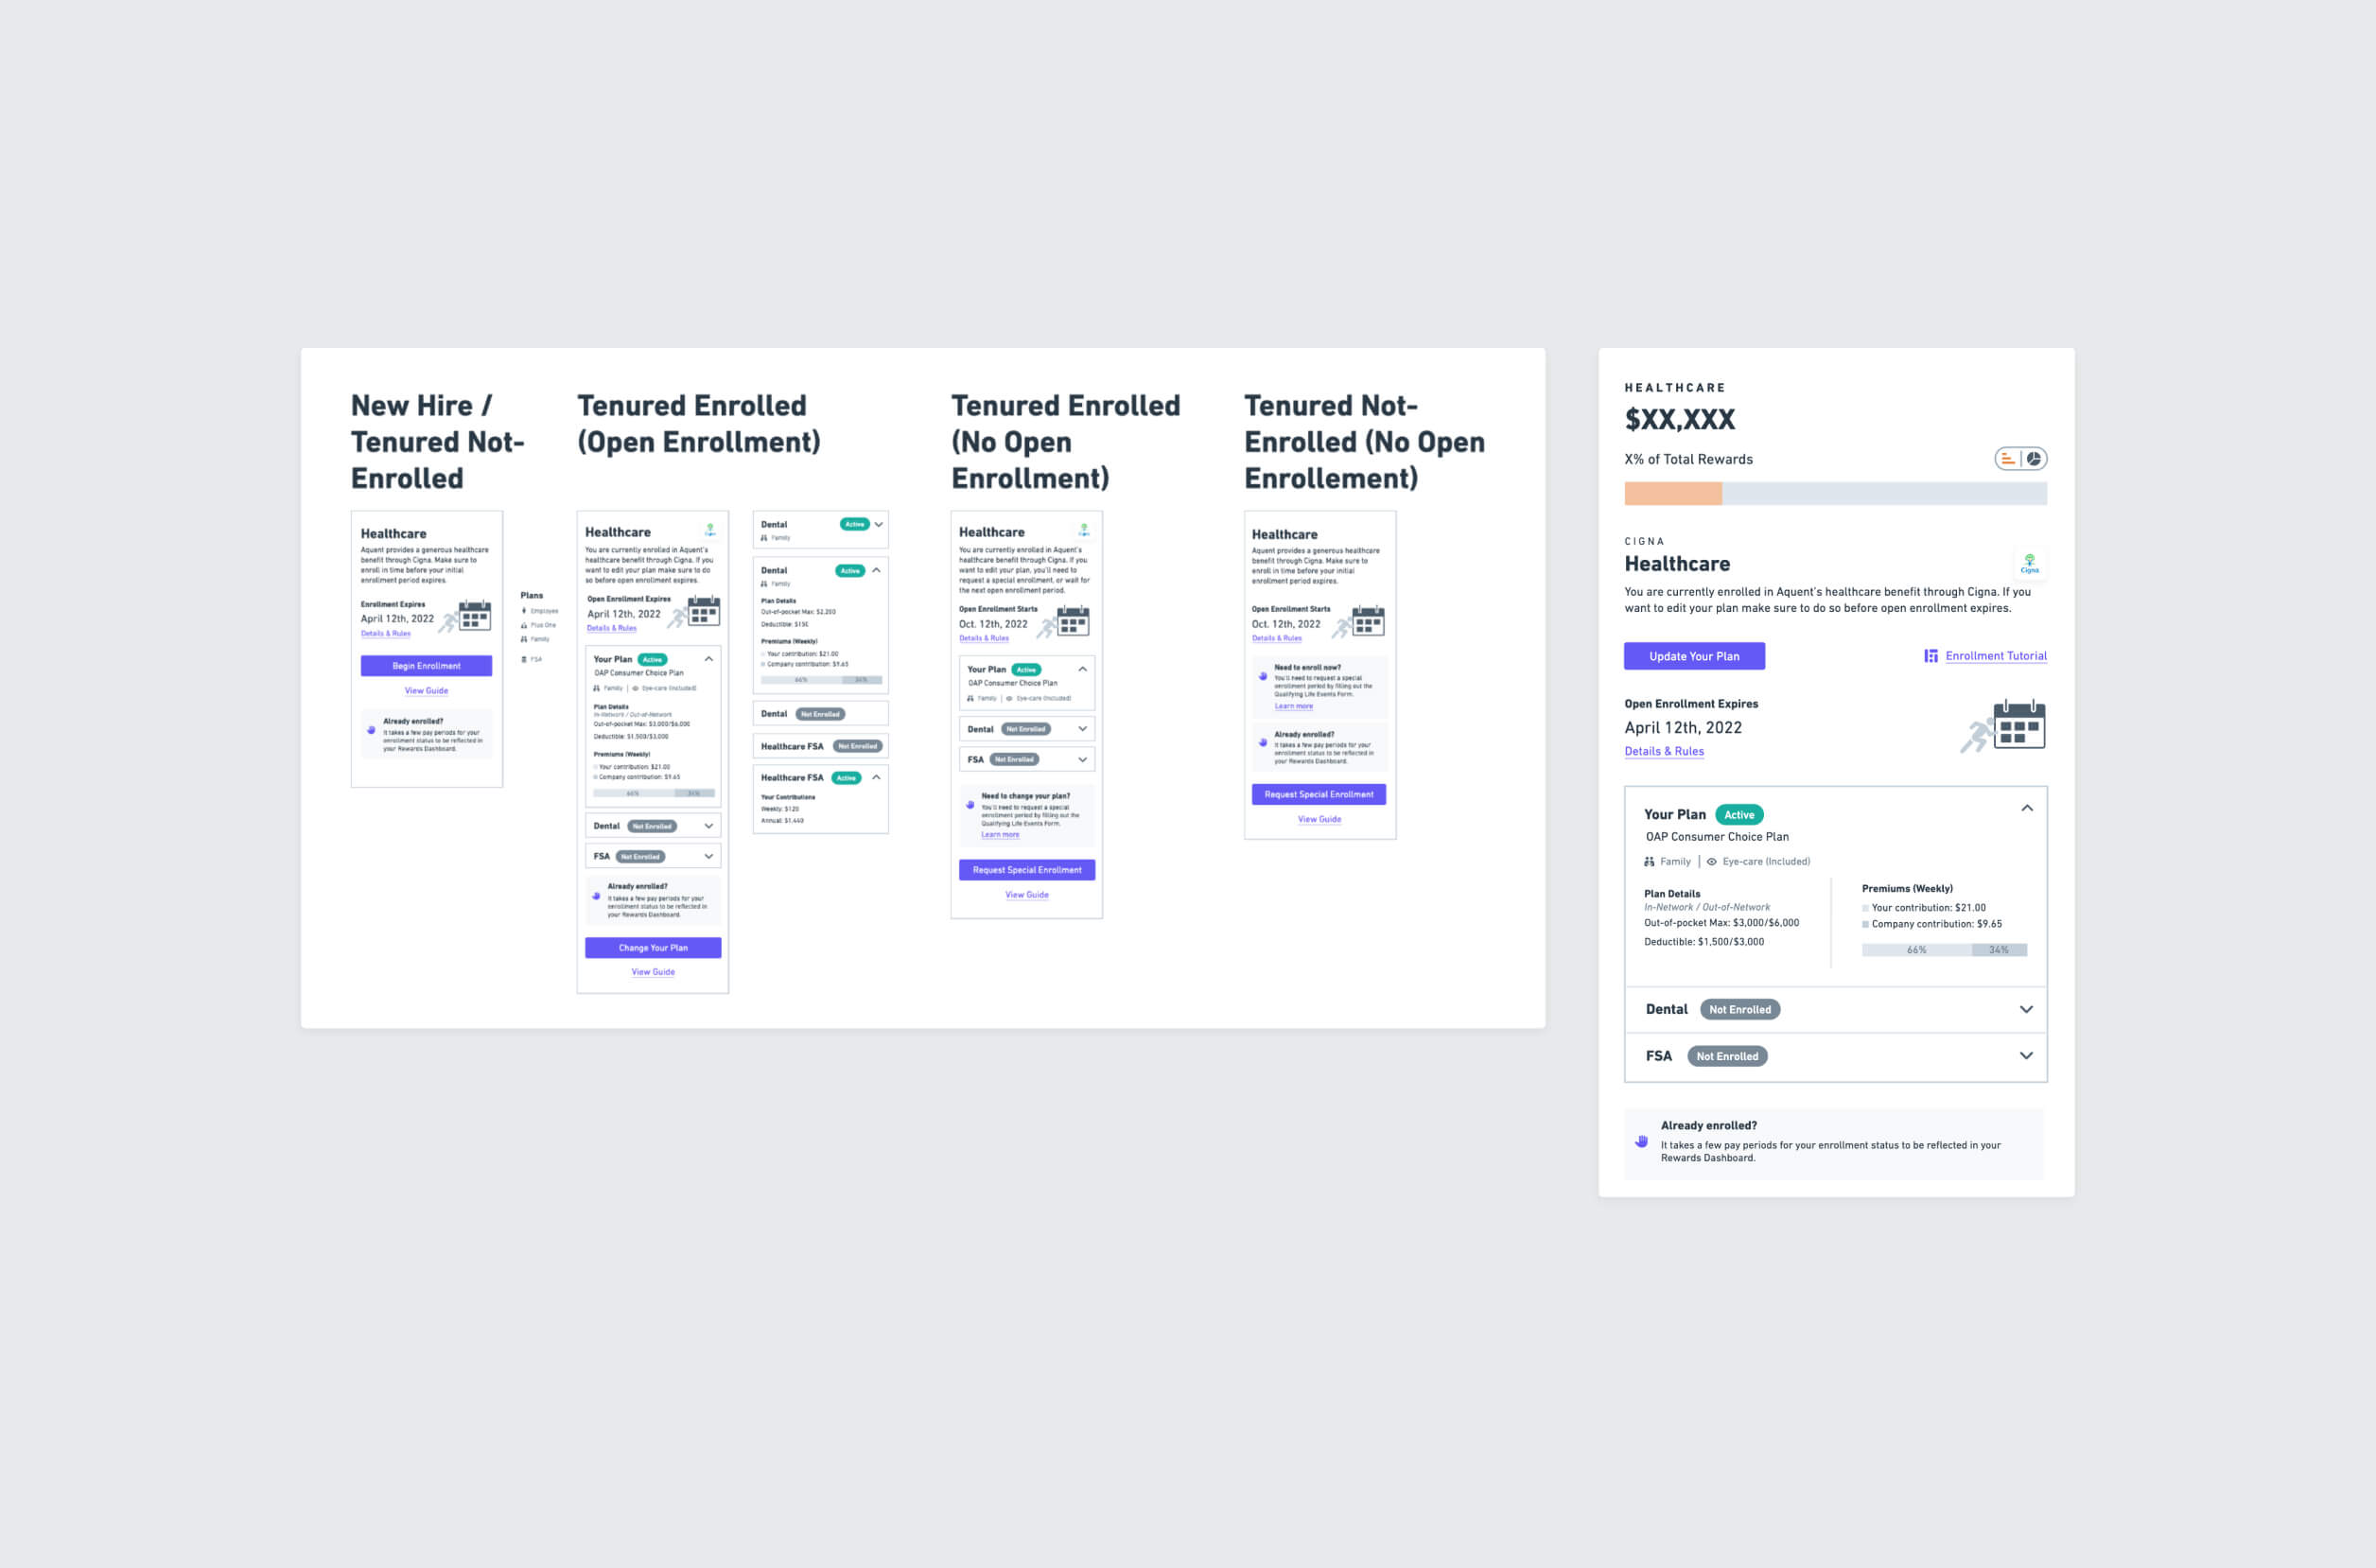
Healthcare
Users were given a snapshot of plan details and premiums, as well as links to Cigna's enrollment portal. Various scenarios were mapped out depending on the user's enrollment status and if it was an enrollment period.
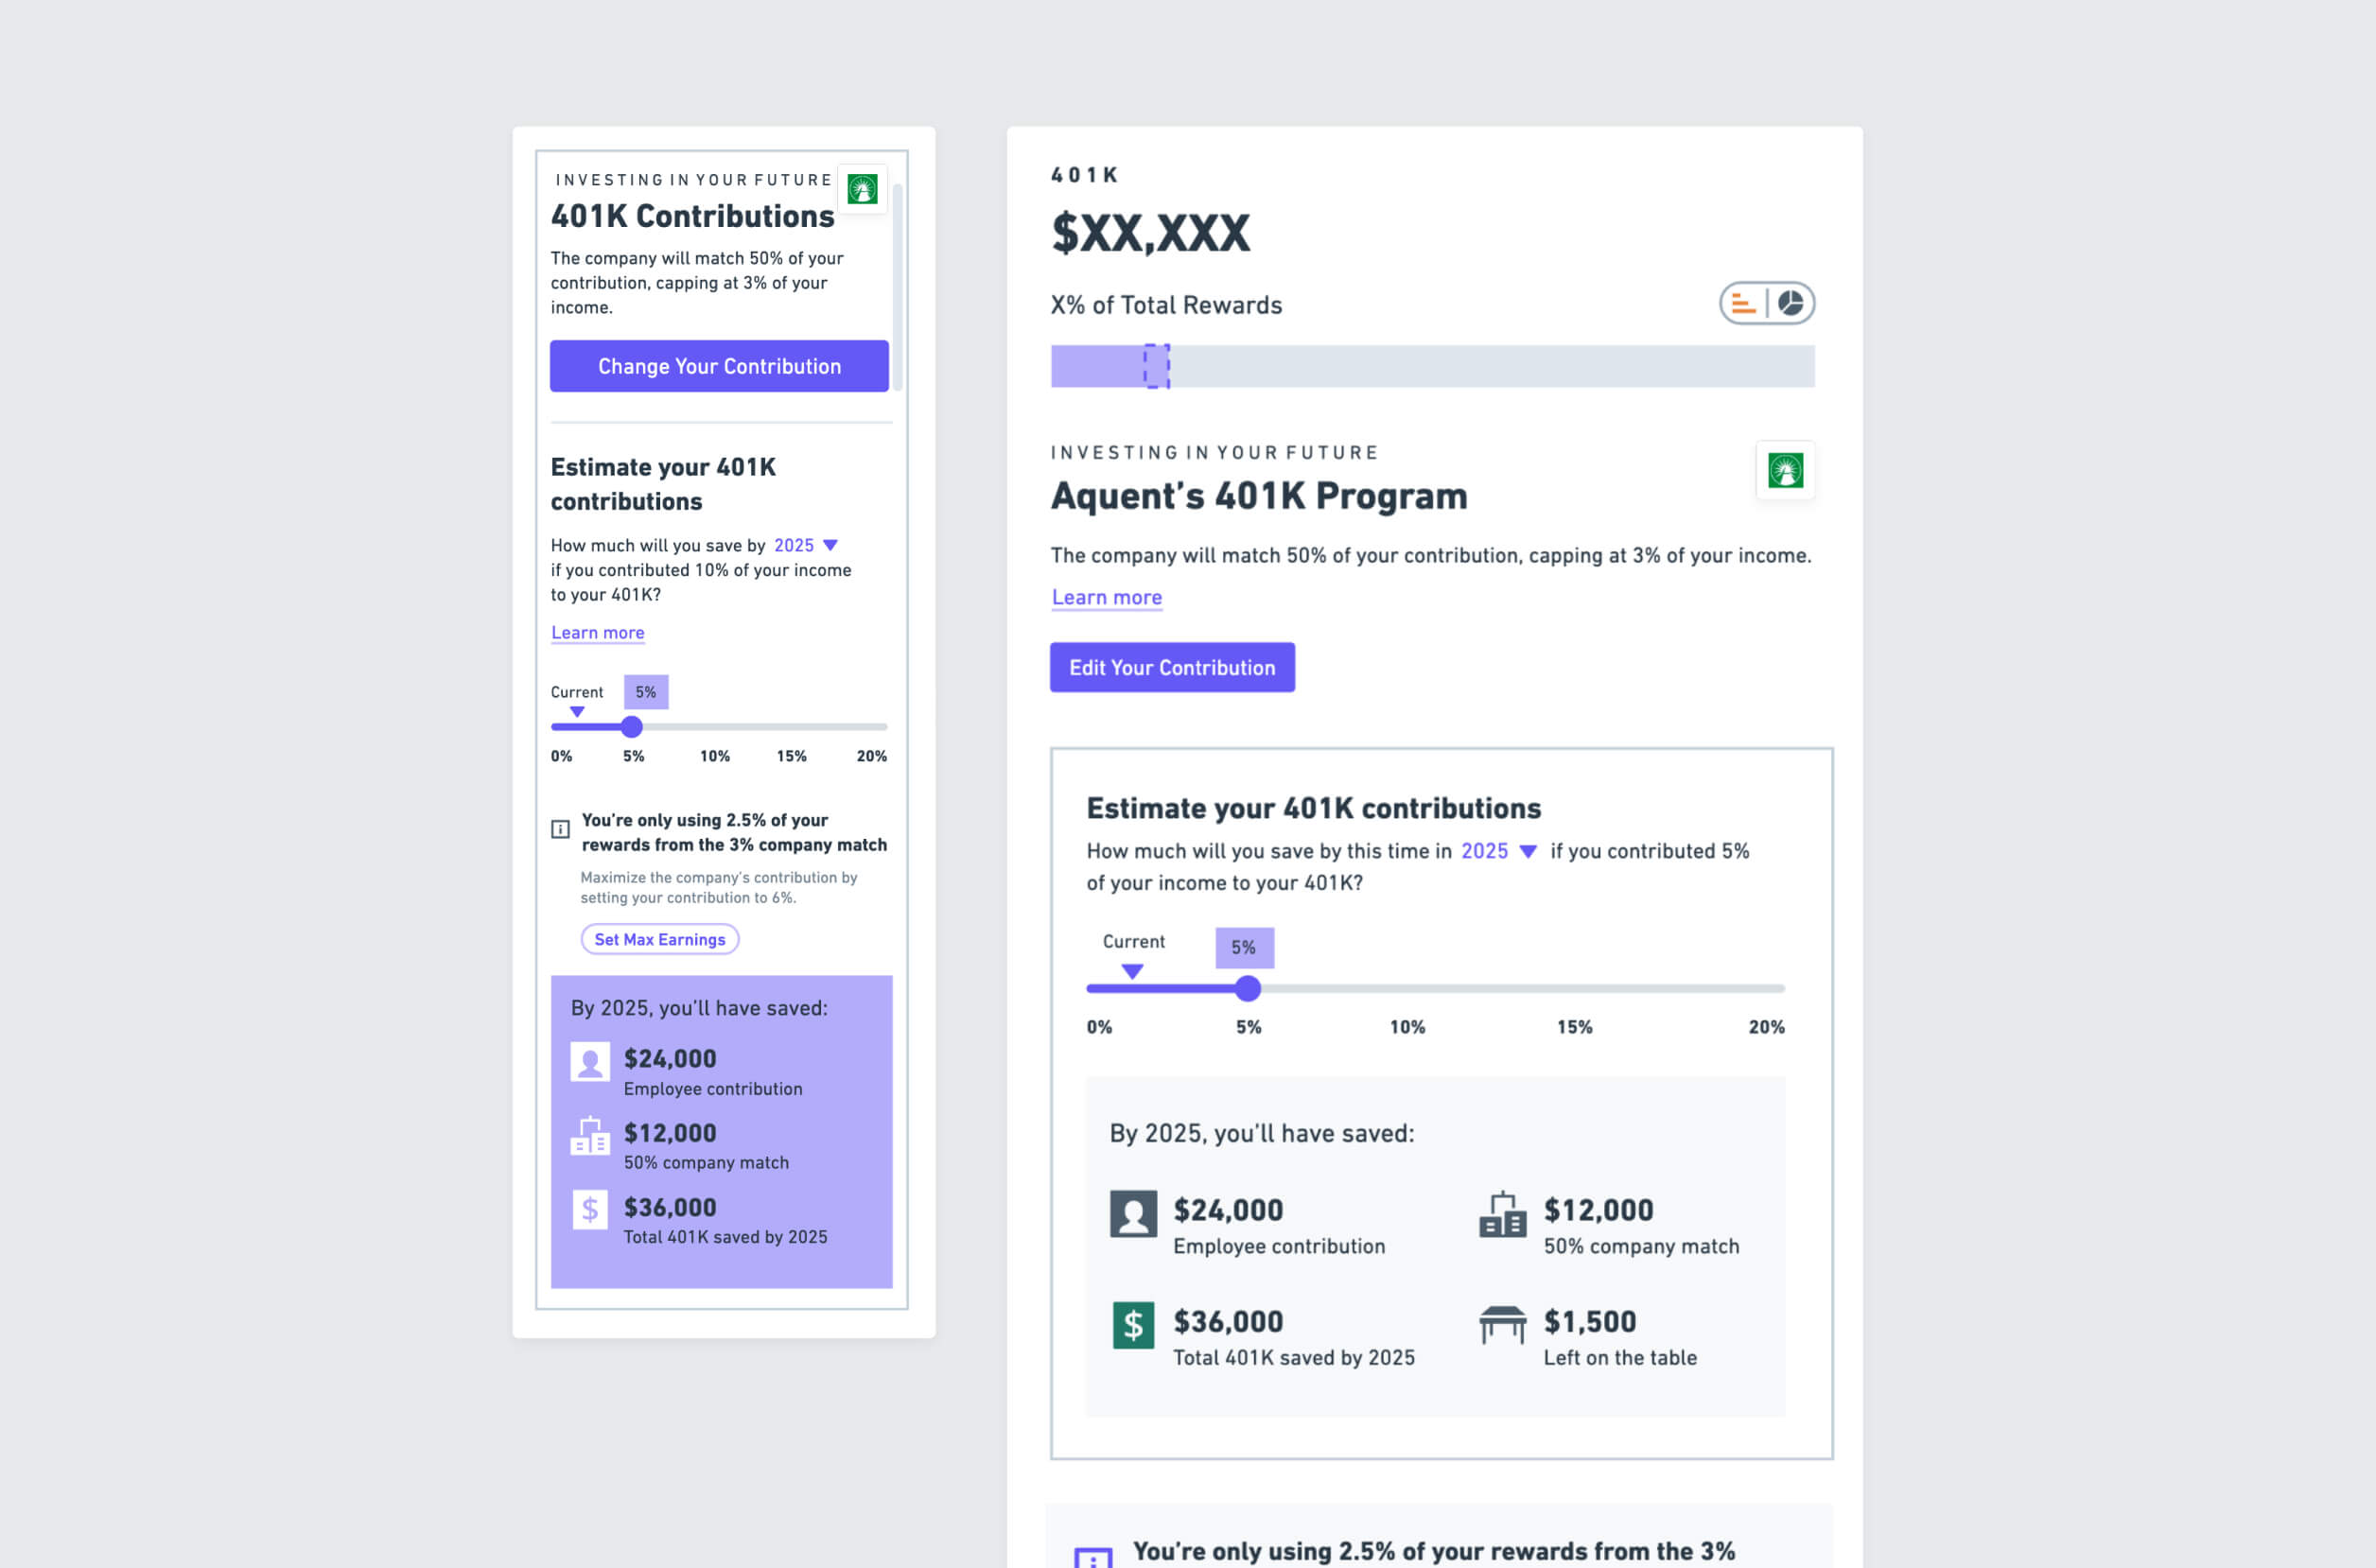
401k
A retirement calculator pulled employee and company contribution data and gave recommendations. Above were links to Fidelity's portal where users could update their contributions.
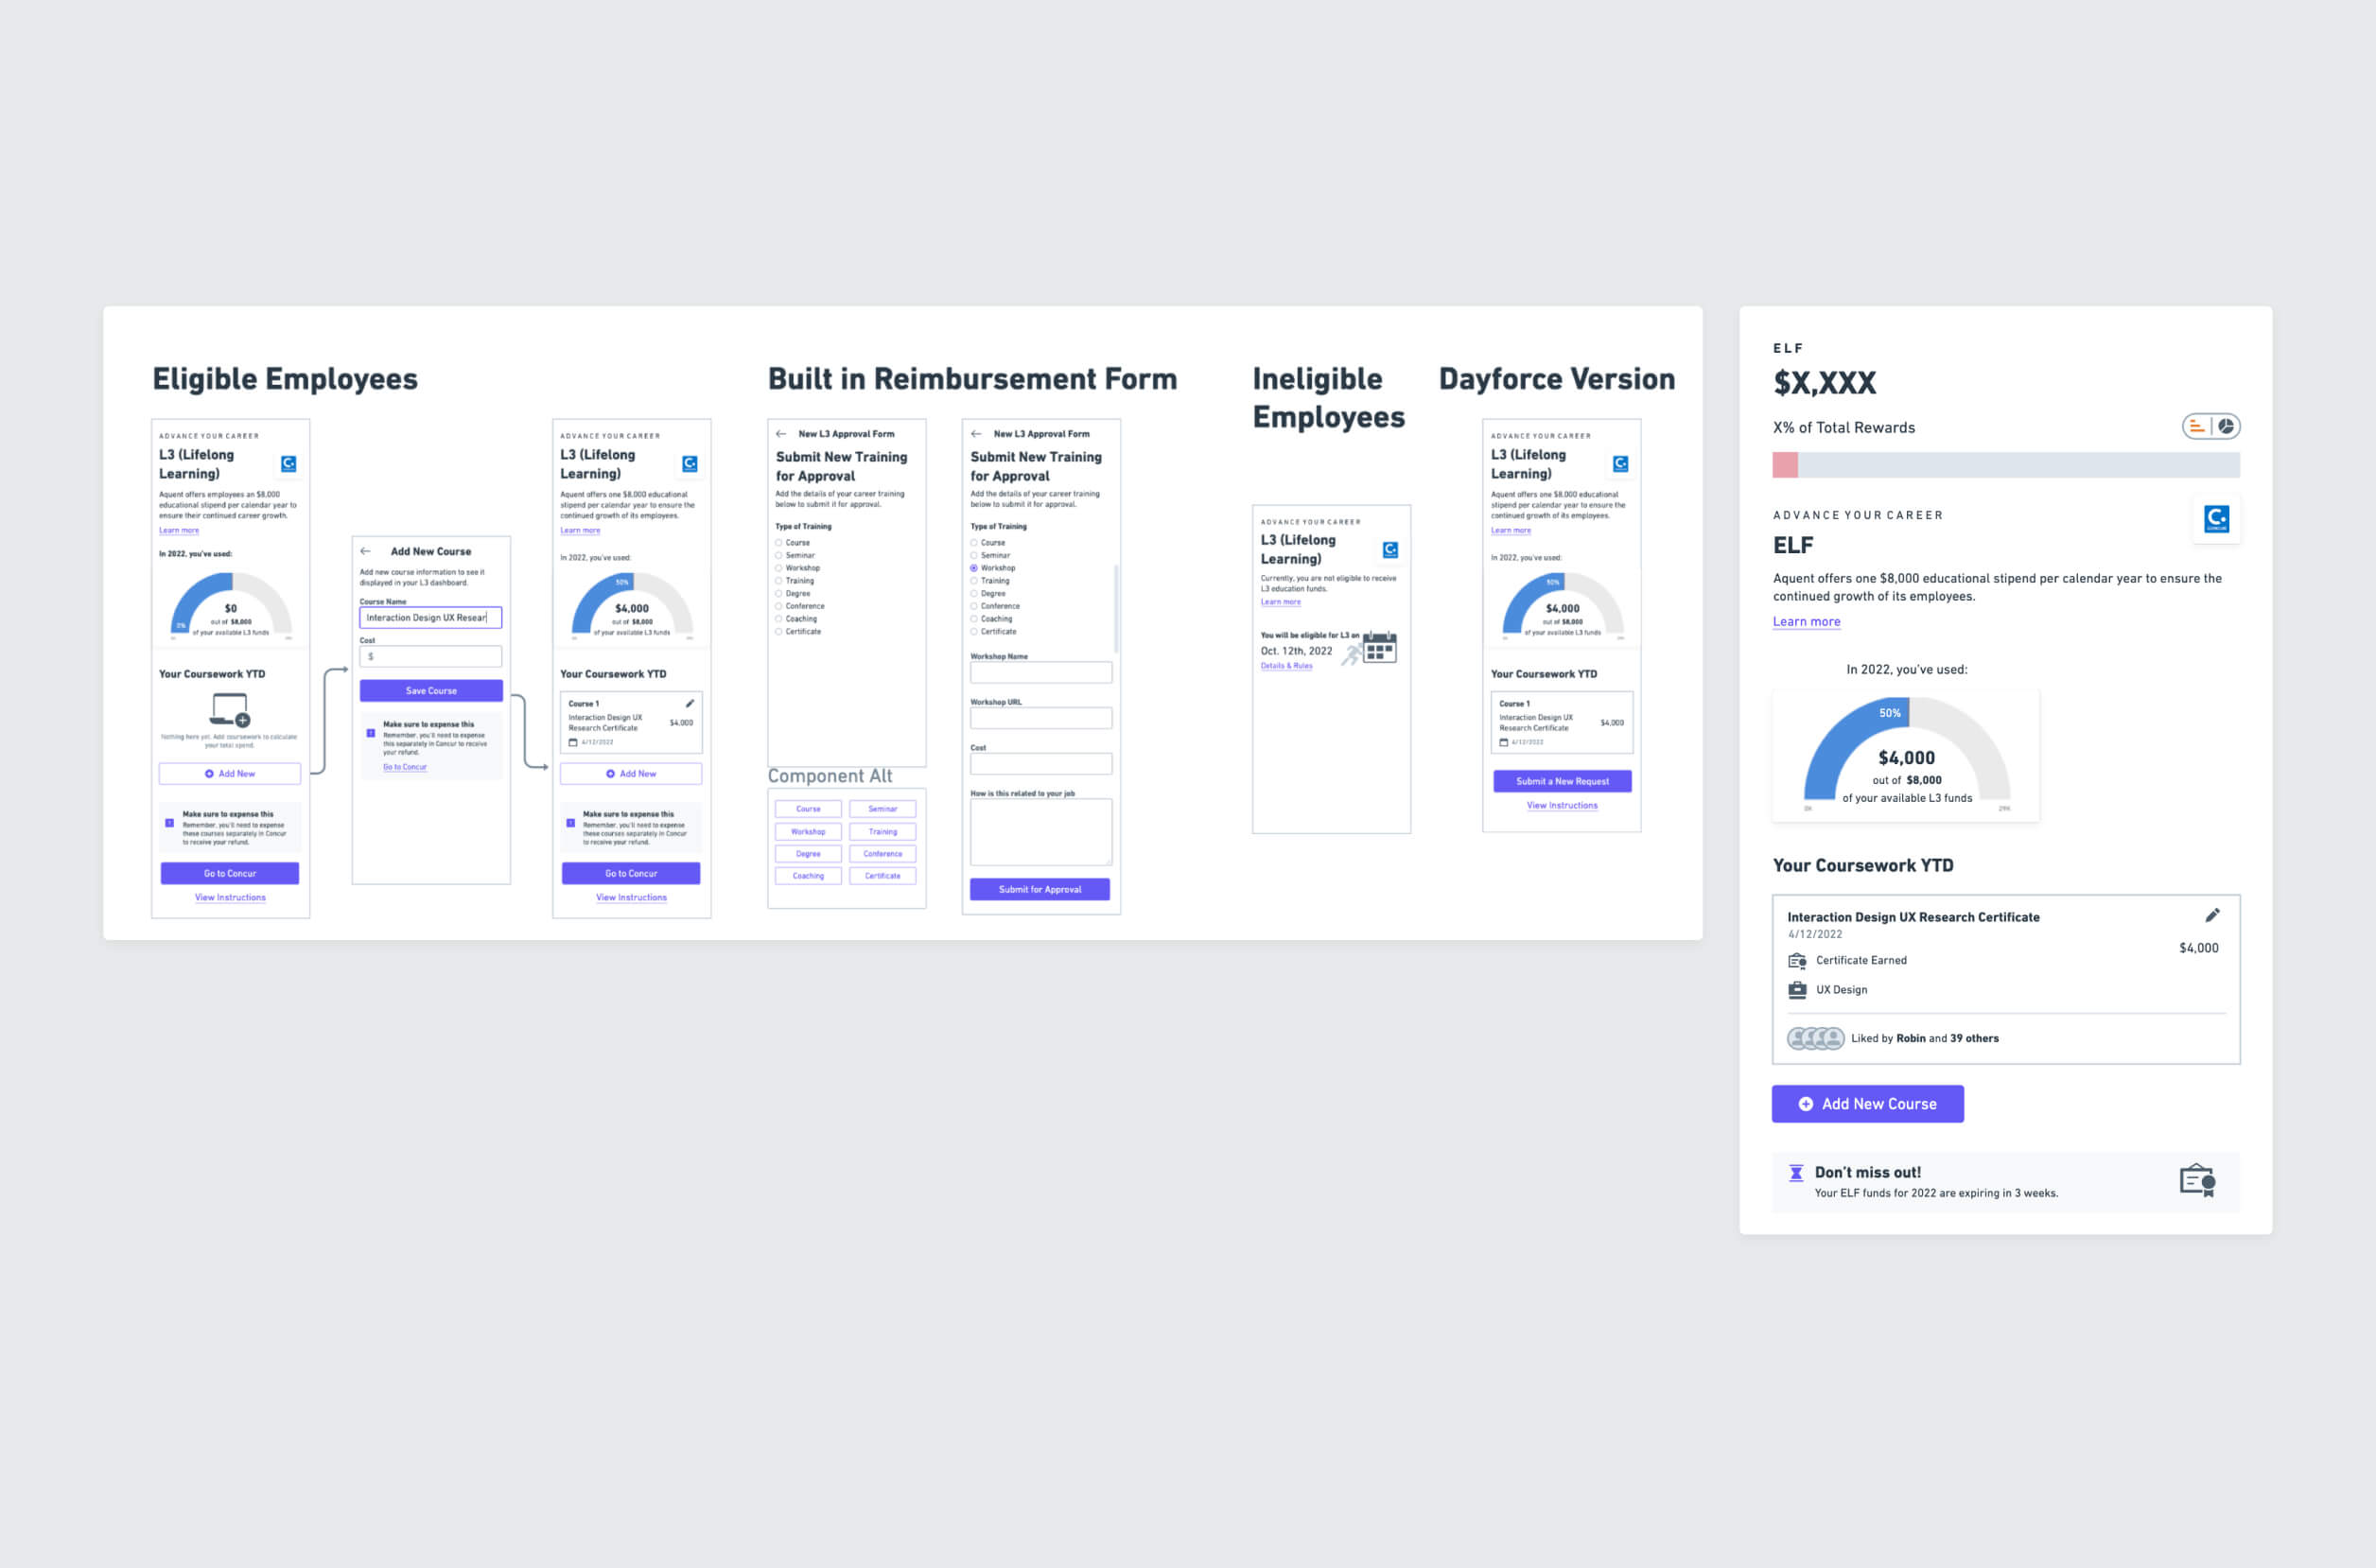
ELF
The previously confusing approval process for Aquent's $8,000 educational stipend, ELF, was built directly into the UI, where employees could submit funds requests to managers for approval. It also showed past coursework, recommended coursework, and total funds remaining.
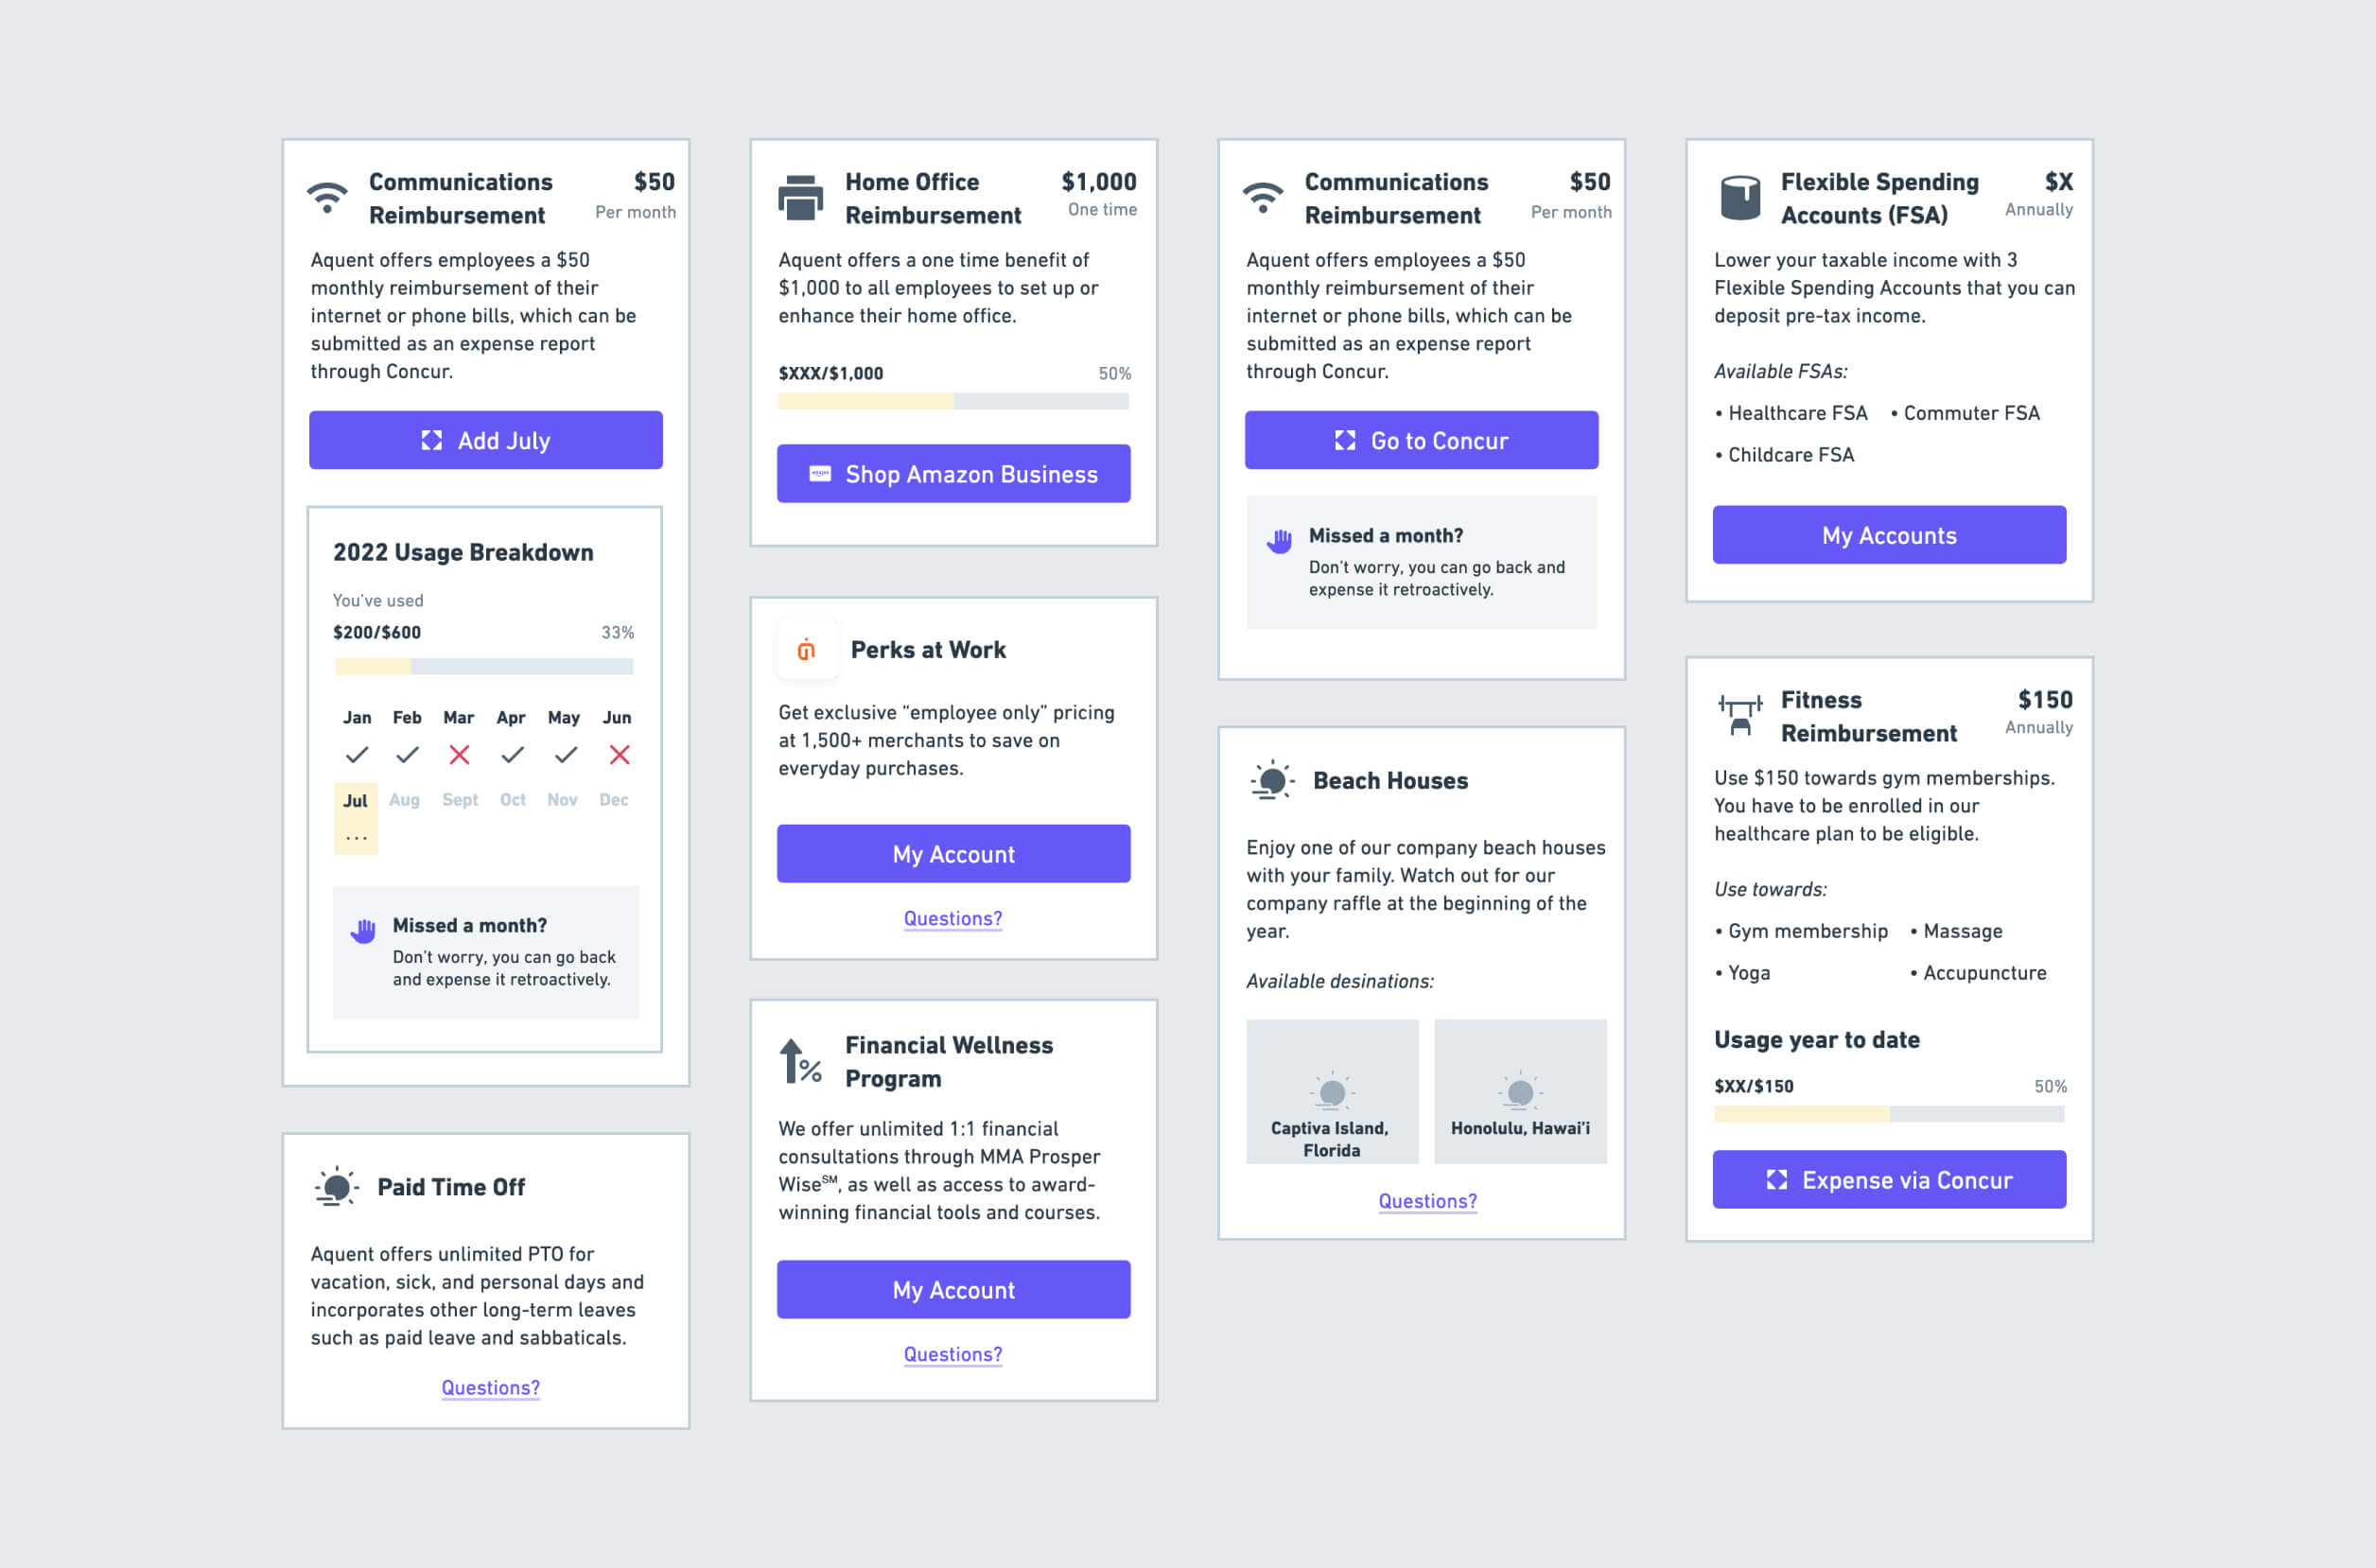
Perks
So many perks, so little time. My favorite? The $50 monthly internet reimbursement that everyone forgets to use. The monthly usage tracker helps employees account for missed months, displaying usage out of the $600 annual total. That reminds me...
Layouts
In this step, I brought the disparate pieces together into a cohesive layout. After lofi wireframes were completed, the team paired back features into an MVP that I presented to Aquent's CEO. The layout we moved forward with improved upon navigational challenges in the original sketches.
.jpg)
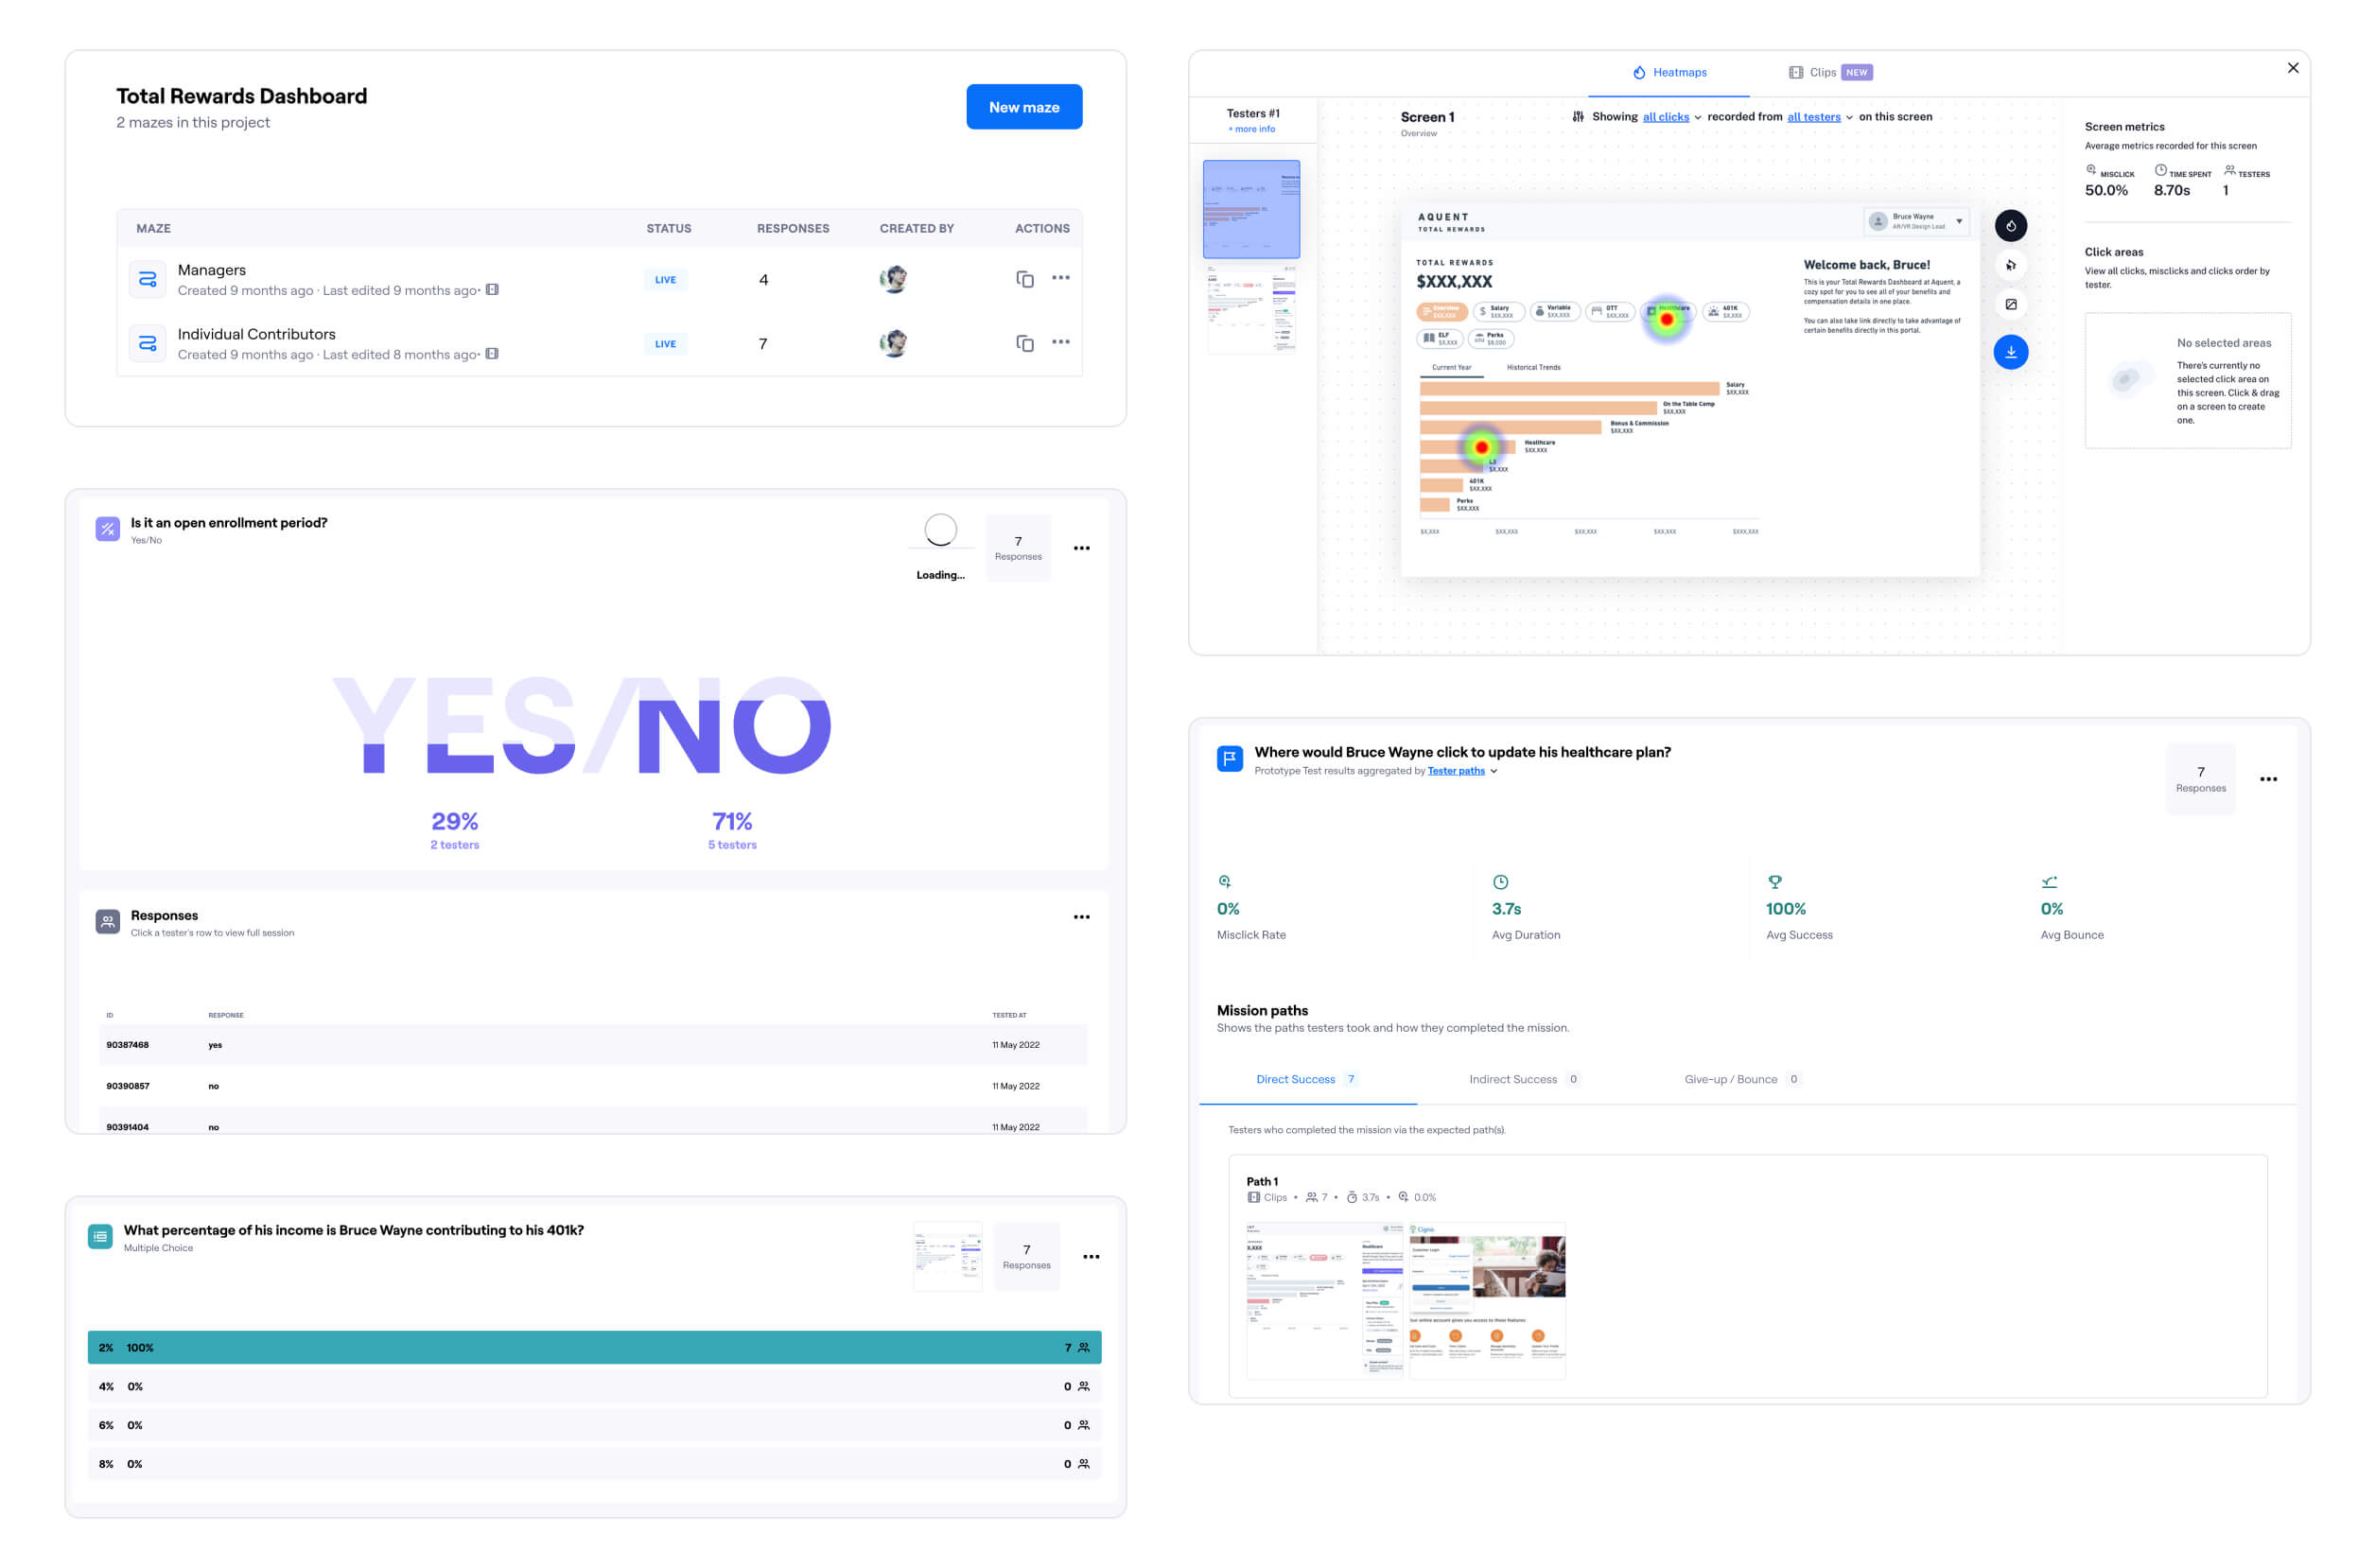
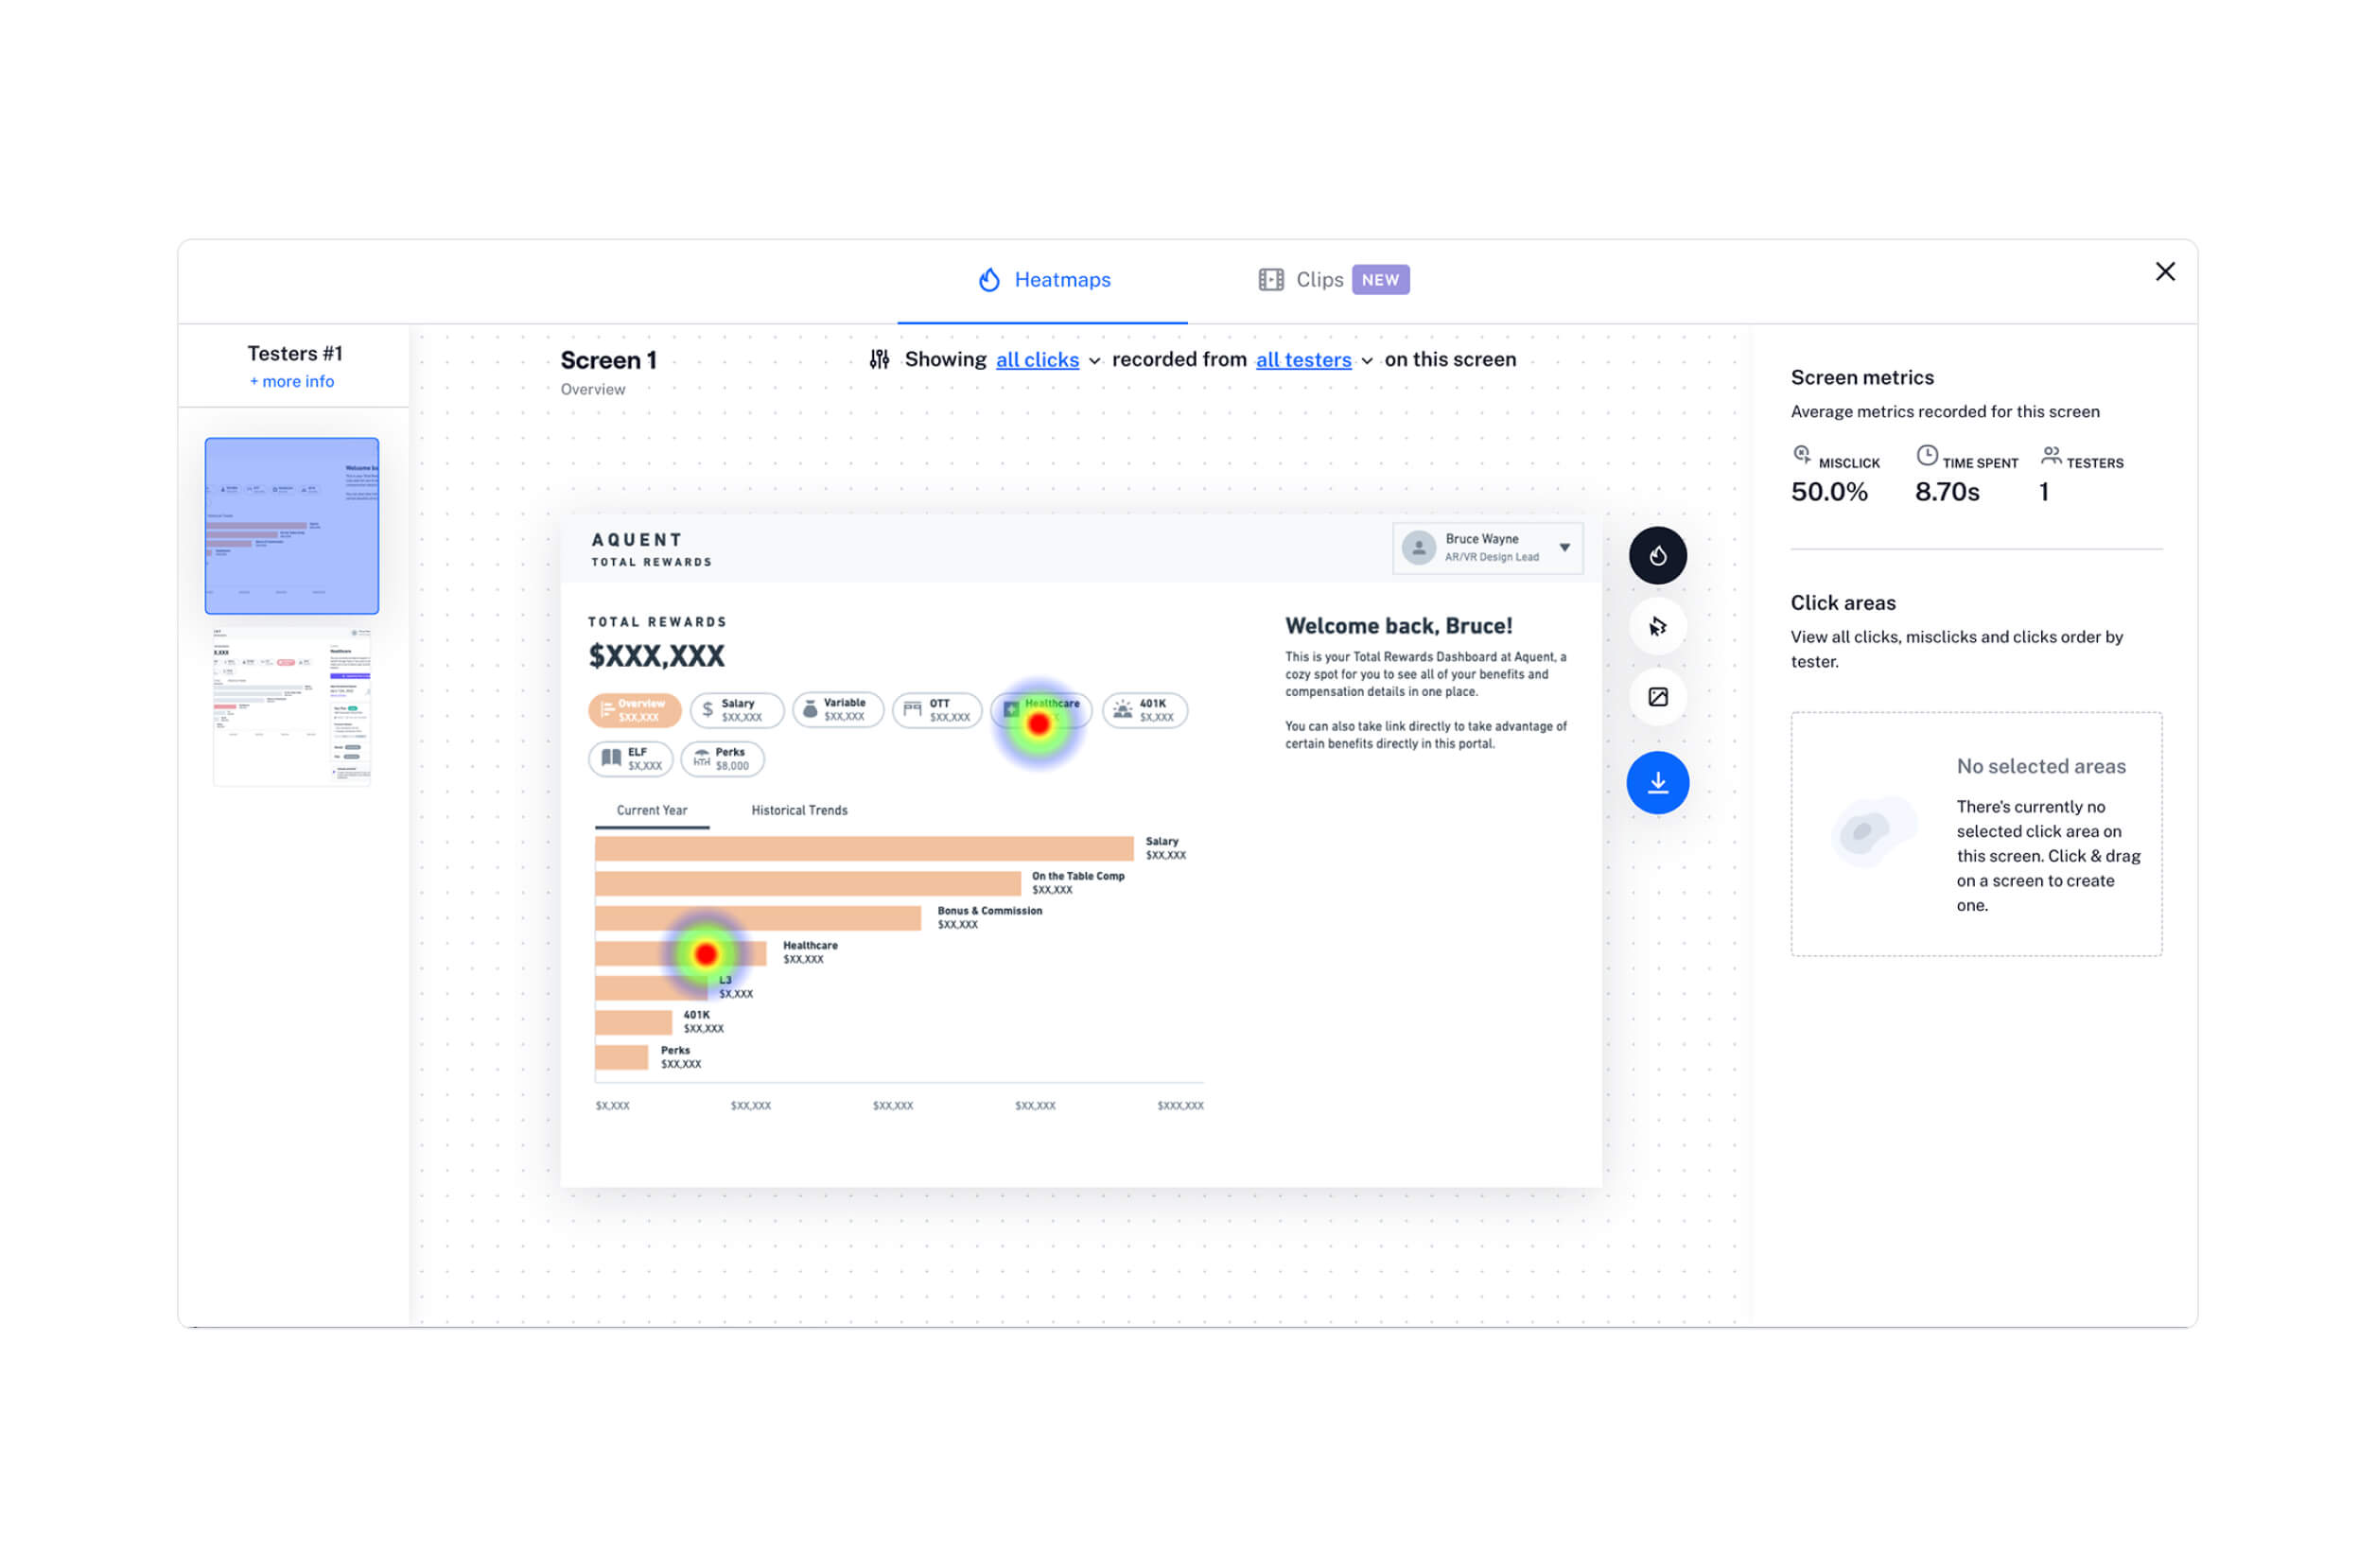
User testing
After presenting my wireframes to the CEO and executive leadership, I worked with the team to draft a testing plan that used Maze missions to validate the design solution. Separate tests were made for managers and individual contributors, with the manager view including the masquerading feature to assist managers with annuals reviews.
Final designs
Following a tech assessment, the first hand-off deliverable was an MVP that prioritized the main data stories and paired back on the feature rich sub-stories. The video below demonstrates the interaction design on desktop in light mode.
Variants
The Final Concept UI, created in Figma, featured both light and dark modes. I utilized pre-attentive attributes like shape, color, and other visual anchors to guide user attention.
1.1 Masquerading
For managers to be able to view the Total Rewards of their direct reports, I included a light-weight masquerading feature with Melpomene and Thalia from ancient Greek drama.
.png)
1.2 Stacked bar graph
Used to section out the seven primary benefits within the overall while demonstrating annual trends. On hover, each section revealed details via a popover (shown in dark mode).
.png)
1.3 Line graph
Used to show year-over-year increases in the Total Rewards figure, with each line utilizing a popover on hover (shown in light mode).
.png)
1.4 Stepped line graph
Used to visualize incremental salary increases with attribution to merit-based raises and promotions (shown in dark mode).
.png)
1.5 Vertical bar graph
The centerpiece of Total Rewards, the bar graph was selected for its legibility (shown in light mode).
.png)
Micro-stories
Utilized to supplement key data stories via punchy syntaxes with large numeric figures (shown in light mode).
.png)
Mobile breakpoint
The mobile version of the web application incorporates a persistent bottom navigation bar that remains fixed at the bottom of the screen, facilitating horizontal scrolling functionality.
.png)
Design system & brand guidelines
The design system utilized principles of atomic design including nested layers. The brand design was actually a placeholder pending a decision to create a multi-brand design system for the company, but I wanted it to have connotations of career growth and personal wealth.
.jpg)
Outcome & results
The design of this data-visualization rich dashboard was completed in about three months, from inception to delivery. The MVP was warmly received by internal employees and executive leadership is contemplating white-labeling the service to other companies.


Johan Bilean
CTO, Google, Ex-Aquent


Jeffrey Simmons
Director of Product, Lightcast, Ex-Aquent


Matt Pozos
COO, Scout / Aquent
Up next
Continue exploring my work below.
.jpg)
.jpg)